Unlock Observability Data within Workload Automation and Orchestration
Observability enhances traditional monitoring by providing actionable insights based on telemetry data from disparate, loosely connected sources. Learn how to tap into telemetry data from your workload automation and orchestration solutions.

Companies are eagerly adopting new telemetry data standards as they grapple with the complexities of monitoring, improving, and troubleshooting distributed system behavior in cloud-native and SaaS-based applications. After all, enterprises understand that observability is all about correlating what is going on in a complex process that spans many systems. The more data it yields, the more you can collect and the more you can correlate.
One major source of telemetry data is your workload automation (WLA) tool or, the more modern, service orchestration and automation platform (SOAP). However, obtaining telemetry data isn’t available from all automation and orchestration solutions.
The good news is that the platforms that do offer a way to tap into telemetry data have doubled down. Yes, they offer telemetry data about automation and orchestration from their system. But they also offer telemetry data from all the applications and infrastructure they connect to.
If observability and telemetry sound like foreign words, don’t worry. We offer a primer on the terminology below. Then, we’ll discuss how to make use of huge amounts of operational data — just by tapping into the right, centralized orchestration platform.
Observability vs Monitoring vs Telemetry
The difference between observability and traditional monitoring data can be a little confusing. These terms are often used interchangeably. When telemetry is introduced to the equation, these concepts are even more nuanced. Let's go ahead and unpack the differences of each.
Observability
Observability is an approach that helps you understand and measure what’s happening inside individual systems based on, or inferred by, the data it generates. In the context of this article, observability is focused on the overall health of your hybrid IT environment and the data flowing through it.
Telemetry Data
When people talk about telemetry, they often associate it with observability. Telemetry data is generated, collected, and transported from multiple distributed systems. Telemetry data enables observability.
- Telemetry data is typically segmented into three pillars:
- Metric data: identify that a problem exists
- Trace data: identify where a problem exists
- Log data: identify what the problem is
- Metric, trace, and log data by themselves do not create system-wide observability. Rather, they power observability when they are properly collected, monitored, analyzed, and acted upon.
Monitoring
Monitoring refers to the actual act of observing a system to detect errors, send alerts, and improve performance. Monitoring is a part of observability. Often, monitoring is where you employ visualization tools, AI, or other automated remediation.
Examples of monitoring solutions include application performance monitoring (APM), data visualization, and business intelligence tools.
Seriously, Isn’t Observability Just Monitoring?
In one form or another, monitoring has been around as long as IT teams have existed. Meanwhile, the concept of observability has become more important as enterprises move from monolithic application architectures to architectures spread across distributed system architectures and cloud-native services.
In other words, it was much easier to pull data to monitor out of a few big applications than to pull data out of a whole bunch of smaller ones. The main drivers of the need for observability have been containerization, microservices, DevOps and data pipelines, and hybrid IT landscapes.
Standardized Telemetry Data
Telemetry data makes the monitoring of distributed systems possible because it has been standardized by the OpenTelemetry project and is growing in adoption. In fact, OpenTelemetry has been adopted by most major cloud service providers and many SaaS applications.
In contrast to traditional application data, OpenTelemetry provides a framework for systems to emit key data about their internal health and performance. It includes timestamps, illustrates the end-to-end journey of a request across your distributed system, and payloads that offer context. No longer do external tools need to pull the data out of a system.
Observability in Workload Automation and Job Scheduling
A workload automation solution, or a more modern service orchestration and automation platform (SOAP), plays a central role in collecting data from multiple systems.
As an orchestrator of automation across a hybrid IT environment, a WLA or SOAP must be connected via integrations to various on-premises and cloud-based applications. This creates an opportunity to capture telemetry data so that you can send it to the right observability tools.
Universal Automation Center – OpenTelemetry Connector
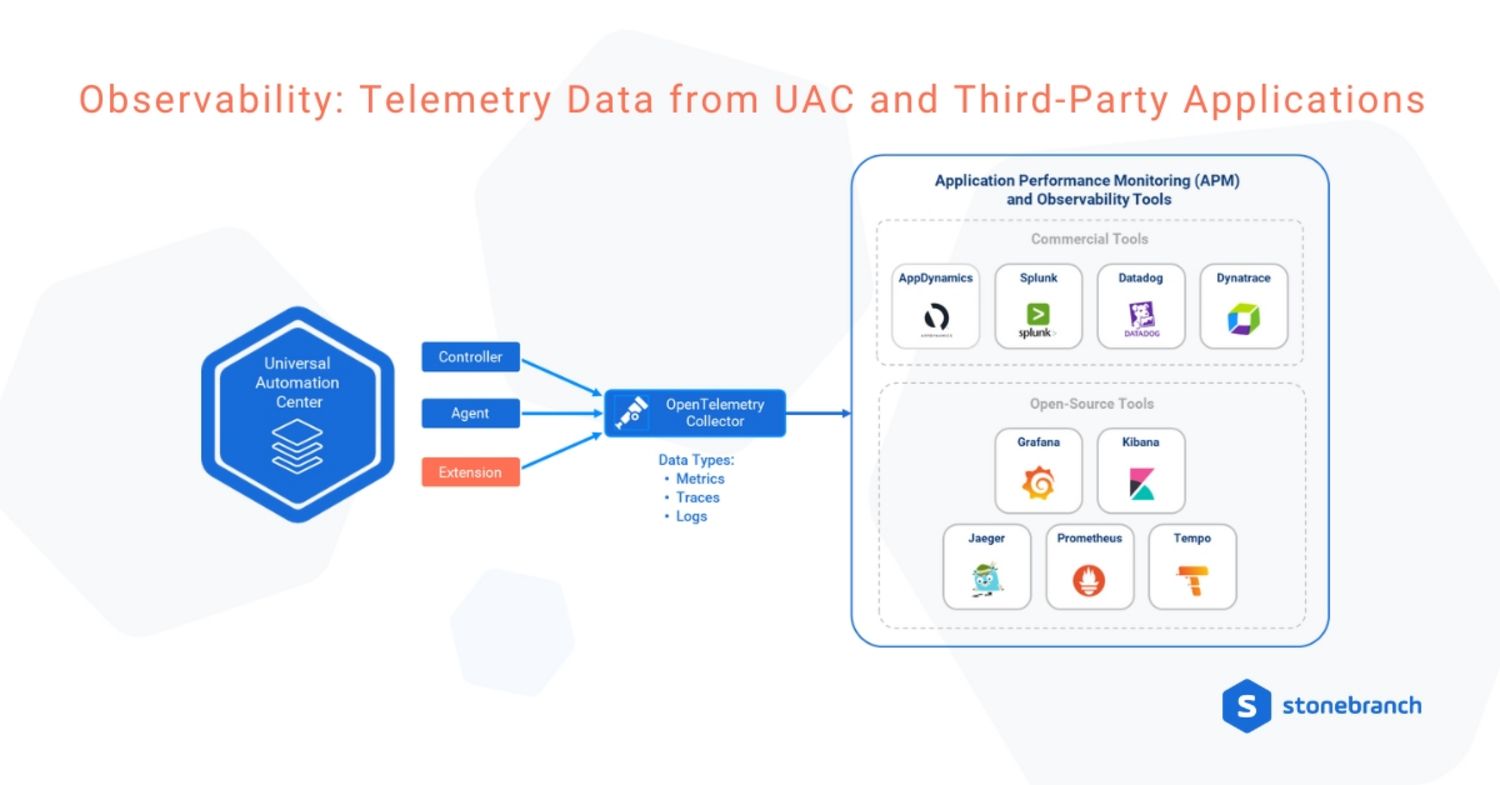
At this point, you’ve likely guessed that UAC offers observability via telemetry data. In UAC version 7.5, we introduced the OpenTelemetry connector. This feature makes telemetry data created by the UAC and other third-party applications available via the OpenTelemetry standards. Below are just some of the major benefits.
- Pass automation-centric data created by the UAC: from an operational standpoint, you gain metric, trace, and some log data with the 7.5 release. Even more log data will become available in future releases.
- Pass telemetry data generated by third-party applications: UAC extensions (integrations) allow APIs to publish telemetry data to the UAC. This means that UAC can collect and pass telemetry data from any of these integrated endpoints.
- Collect telemetry data from applications that don’t have a native telemetry connector: not all tools have OpenTelemetry connectors. However, UAC can act as a bridge that helps you extract telemetry data from any application with which UAC is integrated.
- Get a head start on data visualization: all Stonebranch-certified integrations created post-UAC 7.5 release, provide a Grafana dashboard that displays the data of the respective integration.
- Output telemetry data to third-party observability tools: the OpenTelemetry connector allows you to output telemetry data to application performance monitoring (APM) tools (like Splunk, Dynatrace, and DataDog) and open-source observability tools (like Grafana, Kibana, and Jaeger).

A Practical Example of Using OpenTelemetry Data
Without OpenTelemetry data, finding a specific error in a log file would require finding someone with access to that log file. Then you’d need to convince them to go look it up and match the log file to the error in the workflow.
With OpenTelemetry data, the heavy lifting is already done. Not only does the UAC extract that level of detail, but it also helps you connect the dots between the end-to-end journey of the process. Using that information, you can then seamlessly visualize metric, trace, and log data with tools like Jaeger and Grafana. No need to manually review log files to find the problem. You’ll be able to view the trace data that will take you right to the issue.
Summary
Observability isn’t just a buzzword. It’s an important way to fully understand the complexity and interdependencies of your hybrid IT environment. Automation and orchestration platforms provide a litany of telemetry data. UAC goes beyond its own boundaries and helps you collect telemetry data from just about any application.
Want to learn more? Check out the Observability Start-Up Guide.
Start Your Automation Initiative Now
Schedule a Live Demo with a Stonebranch Solution Expert


