Product Training

How to Collect and Analyze Metrics Data with Grafana

Learn how to collect metrics data from Universal Automation Center and display it in the Grafana dashboard using Prometheus as a data source.
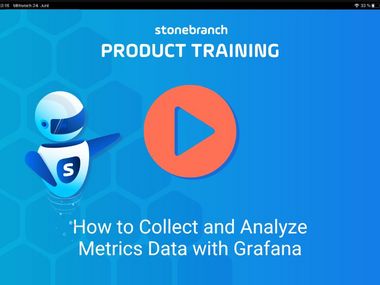
Watch now! UAC Product Training: How to Collect and Analyze Metrics Data with Grafana

This 20-minute product training video equips you with the tools and knowledge to seamlessly connect your UAC data to Grafana, your one-stop dashboard for powerful data analysis. This on-demand demonstration walks through each step of setting up the system:

  • Prerequisites and ports for Prometheus, Grafana, and OpenTelemetry (OTEL) Collector
  • Installation and configuration of Prometheus and OTEL Collector
  • Installation and setup of Grafana
  • Configuration of Universal Agents
  • Configuration of a sample dashboard in Grafana

Further Reading

Success Story Anglian Water

Anglian Water: Streamlining SAP Scheduling

Success Story: Anglian Water needed a modern alternative to its process automation and scheduling tool, CPS by Redwood. Stonebranch offered a solution that’s…

Watch the Product Update Webinar | What's New in UAC 7.8 + Universal Portal

UAC 7.8 Product Update Webinar: Automation For All

See how UAC 7.8 makes automation accessible to everyone, from business users to citizen developers. With the new Universal Portal, central IT can securely offer…

Read the blog | Automation Trends 2025: Top Takeaways from the Annual Global State of IT Automation Report

Automation Trends 2025: Top Takeaways from the Annual Global State of IT Automation Report

Discover the top five IT automation trends for 2025, including the rise of automation-as-a-service, hybrid IT orchestration, and the growing role of business…

Header Card Analyst Report: 2022 Global State of IT Automation Report

Stonebranch 2025 Global State of IT Automation Report

The results are in! New research reveals 2025's IT automation and orchestration benchmarks for IT Ops, DevOps, CloudOps, and DataOps teams.