


Product information "Datadog"
Datadog is a cloud-based observability and monitoring platform that provides metrics, logs, traces, and alerting across infrastructure, applications, and services. It offers a unified view of system health through its REST API, enabling programmatic interaction with events, monitors, and log pipelines.
This integration connects Universal Automation Center (UAC) to the Datadog platform, allowing tasks to send telemetry and monitor system health from automated workflows.
Key Features
- Creates a Datadog event from a UAC task instance.
- Query one or more Datadog monitors and optionally fails the task if any monitor is in an alert or no-data state.
- Send a structured log entry to the Datadog log-intake endpoint.
- Each action writes results to UAC output fields so downstream workflow tasks can branch on results.
| Extension Name: | ue-datadog |
|---|---|
| Universal Template Name: | Datadog |
| Vendor Product: | Datadog |
| Version: | 1.0.0 |
| Vendor: | Datadog, Inc. |
| Compatibility : | UC/UA 7.7 and above |
| Support: | Stonebranch Certified |
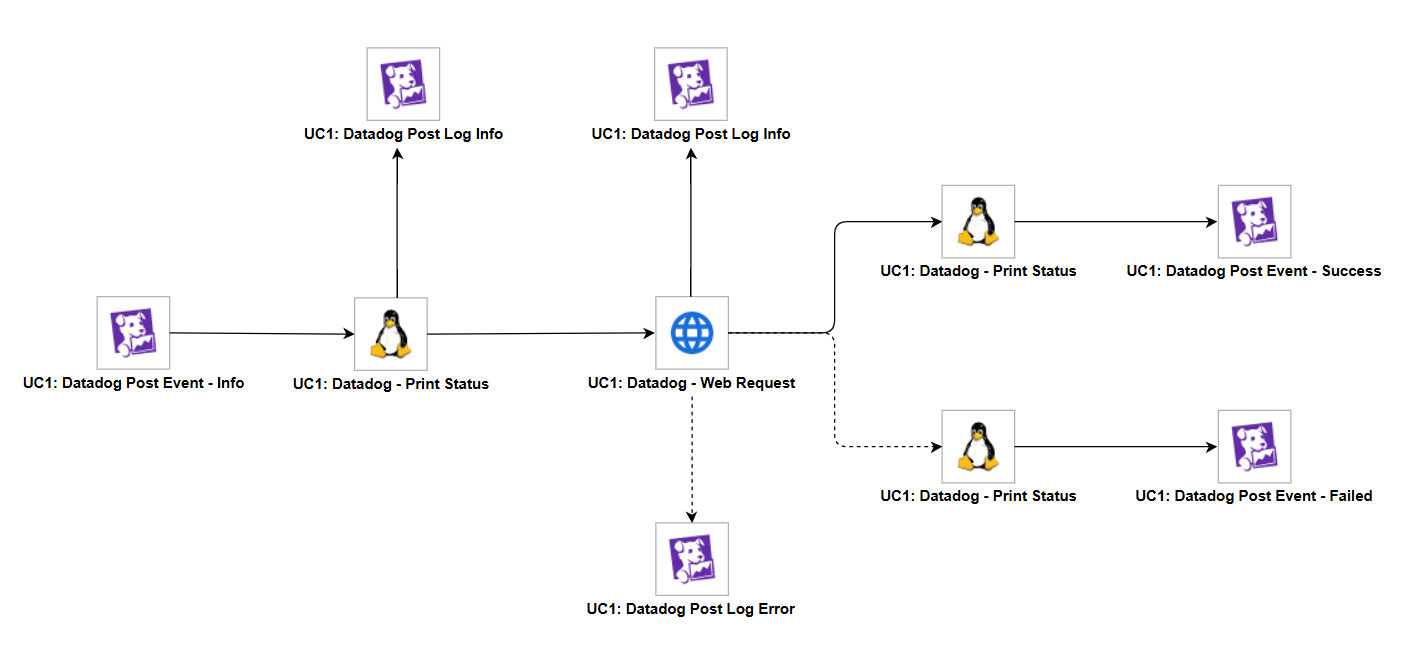
Use Case 1: Datadog Workflow Observability
Description
This use case demonstrates end-to-end workflow observability by integrating Datadog logging and events throughout a multi-step workflow. Datadog events are posted at the start and end of the workflow to mark its lifecycle, while Datadog logs are sent after each intermediate step to provide granular visibility into the workflow's progression. The web service task in the center of the workflow acts as the main point of failure and determines the overall outcome, with separate success and failure paths that post the appropriate Datadog events and logs.
Business Value
- Real-time workflow visibility — Provides operations teams with immediate insight into workflow execution status through Datadog events and logs.
- Proactive failure detection — Error-level logs and failure events are posted when a step fails, enabling rapid incident response and alerting.
- Centralized monitoring — All workflow telemetry is consolidated in the Datadog console, eliminating the need to check multiple systems for workflow status.
- Audit trail — Step-by-step info-level logs create a detailed record of workflow progression for compliance and post-incident analysis.
Technical Capabilities
- Datadog Event posting — Posts informational events at workflow start, and success or failure events at workflow completion, marking the full lifecycle.
- Datadog Log posting — Sends info-level logs after each intermediate step and error-level logs on failure, providing step-by-step observability.
- Web Service task execution — Performs an HTTP request as the primary workflow task, with its outcome determining the success or failure path.
- Conditional branching — Routes the workflow through success or failure paths based on the web service task result, with each path executing the appropriate logging and event actions.
- Linux task execution — Runs shell commands to print workflow status to standard output, serving as representative placeholder steps for customer-specific workflow logic.
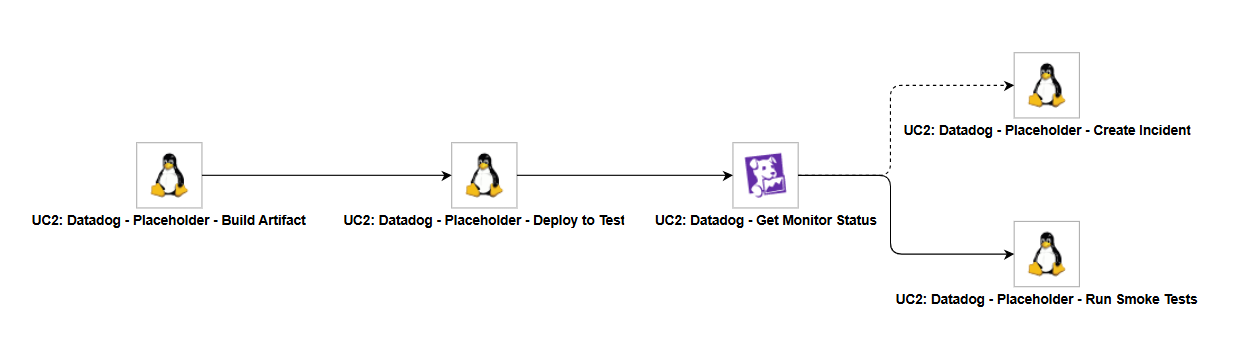
Use Case 2: Automated Deployment Health Verification
Description
This use case demonstrates automated deployment health verification by querying Datadog monitors before allowing downstream deployment activities to continue. The workflow simulates a deployment pipeline that builds an artifact, deploys to a test environment, and then checks the health of critical infrastructure monitors in Datadog. If any monitored service is in an alert state or reporting no data, the workflow automatically halts and triggers incident creation. If all monitors report OK, the workflow proceeds with downstream smoke tests. The Linux tasks in the workflow are lightweight placeholder steps that simulate a real deployment pipeline, keeping the focus on the "Get Monitor Status" action and the resulting branching logic.
Business Value
- Deployment safety gate — Prevents deployments from proceeding when critical infrastructure is unhealthy, reducing the risk of deploying into a degraded environment.
- Automated incident response — Automatically triggers incident creation when monitors are in an alert state, eliminating manual triage and accelerating response time.
- Reduced deployment failures — By verifying infrastructure health before continuing, the workflow avoids costly rollbacks and production incidents caused by deploying during outages.
- Operational confidence — Teams can trust that deployments only proceed when key services — API error rates, database replication, Kafka consumers, pod health, and disk usage — are all within acceptable thresholds.
Technical Capabilities
- Datadog monitor querying — Uses the Get Monitor Status action to check the state of critical Datadog monitors including API error rate, database replication lag, Kafka consumer lag, Kubernetes pod health, disk saturation, and others.
- Conditional workflow branching — Routes the workflow to either incident creation or downstream smoke tests based on monitor status results.
- Deployment pipeline simulation — Executes placeholder Linux tasks for Build Artifact and Deploy to Test steps, representing stages in a real deployment pipeline.
- Automated incident creation — Triggers an incident creation step when any monitored service reports an unhealthy state, integrating health verification directly into the operational response process.
- Smoke test gating — Only proceeds to Run Smoke Tests when all infrastructure monitors confirm a healthy state, ensuring downstream validation occurs in a stable environment.